Fact-checked · , including U.S. Department of Agriculture, U.S. Bureau of Labor Statistics
Credit: Daily Vitality
Key Takeaways
•In USDA's national price data, a gram of nut in a pretzel trail mix costs about 2.7 times what it costs in a can of mixed nuts, and the fruit and chocolate mixes run about twice the can.
•Rebuilding each bag from its own parts costs less every time, and the gap ranges from about 14% for the chocolate mix to nearly 70% for the pretzel mix.
•The chocolate mix is the cheapest bag per 100 grams, yet it is one of the priciest ways to buy the nuts inside it.
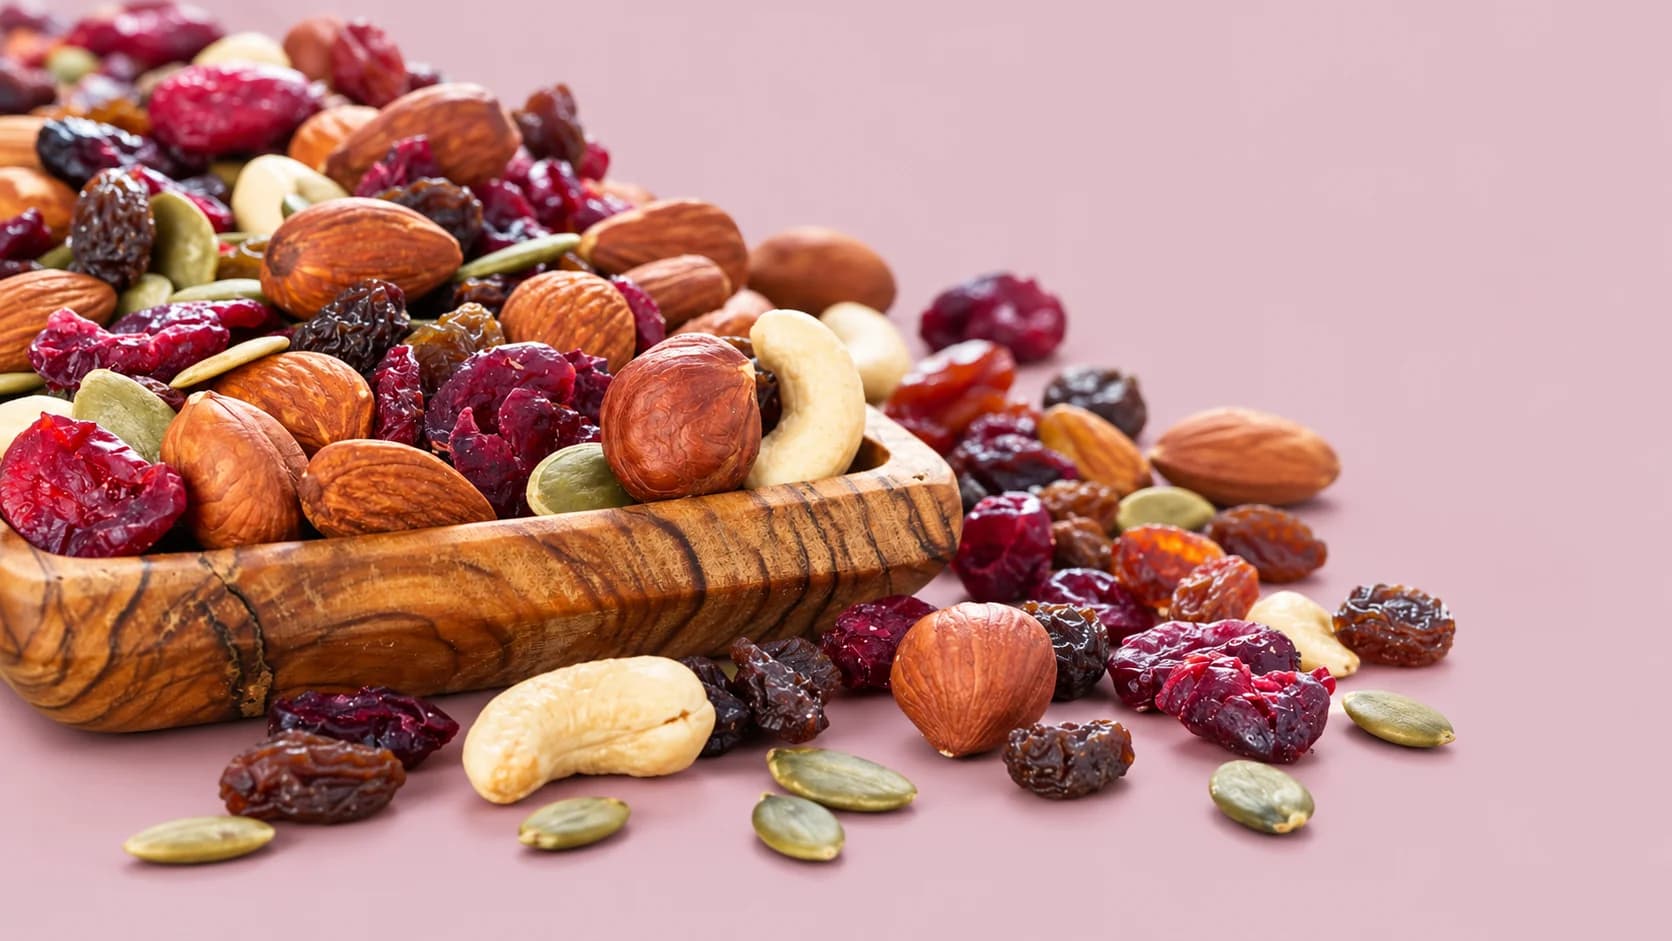
Picture the snack aisle for a moment. On one shelf sits a plain can of salted mixed nuts. A few feet away hangs a cheerful bag of trail mix, flecked with raisins, cranberries, candy-coated chocolate and little pretzel twists, at a price per ounce that looks almost the same. Most of us read those two price tags as a fair fight, and on the shelf, they nearly are.
The catch is what you are actually paying for. When you pick up the bag, you are not just buying nuts at a similar price. You are buying fewer nuts, padded out with ingredients that cost the manufacturer less than the nuts do, and then paying a premium for someone else to do the mixing. We call that premium the trail mix tax, and for National Nut Day on October 22, we set out to measure it.
To do that, we paired two free USDA datasets: national average grocery prices for four standard styles of trail mix and every one of their ingredients, and the standard recipes that say how many grams of each ingredient go into 100 grams of each mix. That let us work out what a gram of nut really costs in each bag, and what the same recipe would cost if you built it at home from the parts. The full worksheet is below, so you can check every number.
What a gram of nut costs, bag vs. can
Let's start with the number that frames everything else. When you divide each bag's price by the share of its weight that is actually nuts and seeds, the gap between the can and the bag opens up quickly.
The prices come from the USDA Economic Research Service's Purchase to Plate national average prices, which link grocery scanner data to the foods Americans report eating. Every figure here is from the 2017/2018 release, which is the newest one available, and every figure is priced per 100 edible grams.
Here is how it shakes out. A can of salted mixed nuts with peanuts costs $1.25 per 100 grams, and because it is all nut, that is also its cost per 100 grams of nut. A plain trail mix of nuts and seeds costs $1.41 per 100 grams, which works out to about 12% more per gram of nut than the can. From there, the price of each nut climbs steeply. The chocolate mix works out to $2.51 per 100 grams of nuts and seeds, the fruit-and-nut mix to $2.80, and the pretzel mix to $3.40.
Put in more familiar terms, that is roughly $5.67 per pound of nut when it comes in a can, compared with about $15.40 per pound of nut when it comes tucked between pretzels. The bag prices themselves only differ by a few dimes per 100 grams. The difference lives almost entirely in how much of the bag is nut.
If you enjoy this kind of nut-by-nut math, our comparison of the three most popular tree nuts goes a level deeper into what each one costs and delivers.
The table below is the heart of this piece. Each row is one of USDA's standard trail mix types, with the can of mixed nuts as the baseline. The rows run from the cheapest nut to the priciest, so the biggest tax lands at the bottom.
The nut shares come from the standard recipes in the USDA Agricultural Research Service's Food and Nutrient Database for Dietary Studies, the same database that supplies the protein and sugar values in the last two columns.
Type (USDA food code)
Bag price per 100 g
Nuts + seeds share
Cost per 100 g of nuts + seeds
Built from parts, per 100 g
Mixing markup
Protein per $1
Sugar per $1
Can of mixed nuts with peanuts, salted (42110100)
$1.25
100%
$1.25
$1.25
baseline
15.7 g
3.6 g
Trail mix with nuts and seeds (42500100)
$1.41
100%
$1.41
$1.21
16%
14.3 g
2.9 g
Trail mix with chocolate (42501500)
$1.26
50%
$2.51
$1.11
14%
9.3 g
27.7 g
Trail mix with nuts and fruit (42501000)
$1.40
50%
$2.80
$1.09
28%
7.8 g
26.0 g
Trail mix with pretzels, cereal or granola (42502100)
$1.70
50%
$3.40
$1.00
70%
7.7 g
11.4 g
All prices are USDA 2017/2018 national averages in 2017/2018 dollars. "Built from parts" prices the same recipe from each ingredient's own national average price. Mixing markup = bag price ÷ built-from-parts cost, minus one.
A few things jump out as soon as you read across the rows. The plain nut-and-seed mix is the only bag that comes close to the can on nut cost, and even it carries a 16% premium over its own parts. The three mixes that add fruit, candy or pretzels all sit at 50% nuts and seeds, so their nut cost roughly doubles before the markup is even counted. And the pretzel mix stands apart: it is the most expensive bag on the shelf per 100 grams, while its ingredients are the cheapest of the four to buy separately.
Before we get to the worksheet, it helps to see what USDA's standard recipes actually put in each bag. Think of them as the average trail mix of each style, the version nutrition researchers use when someone in a national survey says they ate "trail mix with chocolate."
Trail mix with nuts and seeds: 80 g mixed nuts and 20 g mixed seeds. This is the only style that is all nut and seed.
Trail mix with nuts and fruit: 40 g mixed nuts, 10 g mixed seeds, 25 g raisins and 25 g sweetened dried cranberries.
Trail mix with chocolate: 40 g mixed nuts, 10 g mixed seeds, 12 g raisins, 12 g dried cranberries and 25 g M&M's milk chocolate candies.
Trail mix with pretzels, cereal or granola: 40 g mixed nuts, 10 g mixed seeds, 12 g raisins, 12 g dried cranberries and 25 g hard salted pretzels.
So the moment a bag adds fruit, candy or pretzels, half its weight stops being nut. That single fact explains most of the jump in the table.
What counts as a "nut" here
It is worth being candid about what a gram of nut means in this math. USDA's standard mixed nuts are themselves a blend: 49 grams of mixed tree nuts to 48 grams of dry-roasted peanuts, plus a little oil and salt. Peanuts are botanically a legume, and they are also much cheaper per gram than almonds or cashews, which is a big part of why the can is such a bargain. The seeds, meanwhile, are three parts sunflower kernels to one part pumpkin seeds.
That peanut share matters if you are comparing against a fancier can. In the same USDA price file, salted mixed nuts without peanuts cost $2.06 per 100 grams, about 64% more than the peanut blend, while salted roasted peanuts on their own cost just $0.57. So when we say "nut" in this piece, we mean the everyday peanut-heavy mix that goes into standard trail mix.
We compared seeds and tree nuts head to head in an earlier piece, if you are curious how the individual players stack up.
Now for the part we promised: the full math on one row, so you can see exactly how the "built from parts" figure is made. We picked the chocolate mix because it has the most ingredients and the most surprising result.
Each ingredient's price is its own national average price per 100 grams in the USDA Purchase to Plate data. We multiply that price by the ingredient's share of the recipe, then add the pieces up.
Ingredient (per 100 g of trail mix)
Grams in recipe
Price per 100 g of ingredient
Cost in the mix
Mixed nuts with peanuts, salted
40 g
$1.2499
$0.4999
Mixed seeds
10 g
$1.0627
$0.1063
Raisins
12 g
$0.8172
$0.0981
Dried cranberries
12 g
$1.1377
$0.1365
M&M's milk chocolate candies
25 g
$1.0657
$0.2664
Built from parts
100 g
$1.1072
Pre-mixed bag
$1.2574
The bag costs about 15 cents more per 100 grams than its own ingredients, a mixing markup of roughly 14%. Run the same arithmetic on the other rows and the savings from building at home look like this:
Nuts and seeds: $1.41 for the bag vs. $1.21 built, about 14% less.
Chocolate: $1.26 vs. $1.11, about 12% less.
Nuts and fruit: $1.40 vs. $1.09, about 22% less.
Pretzels: $1.70 vs. $1.00, about 41% less.
Those percentages are the savings as a share of the bag price, which is why they read a little smaller than the markups in the table. Either way, the direction never changes.
A simpler version of the same idea
You do not need five containers to get most of the benefit. The seeds barely move the total, so a version of the fruit mix made from half mixed nuts, a quarter raisins and a quarter dried cranberries prices out at about $1.11 per 100 grams, still well under the $1.40 bag. A plain half-and-half of mixed nuts and raisins lands near $1.03.
That is the practical heart of the trail mix tax. The more fruit, candy or pretzels a bag contains, the more each gram of nut costs, and a can of mixed nuts plus a box of raisins can rebuild most bags for less. The trade, of course, is a few minutes with a bowl and a spoon, which is the same trade we priced for protein drinks.
Here is the finding that surprised us most. On the shelf, the chocolate mix is the cheapest of the four trail mix bags, at $1.26 per 100 grams. That sounds like good news. Yet it is also one of the most expensive ways to buy the nuts inside it, at $2.51 per 100 grams of nuts and seeds, twice the price of the can.
The explanation is gentle but a little sneaky. A quarter of the chocolate mix is candy, and in USDA's price data the candy cost less per gram than the nuts it replaced. So the chocolate lowers the price of the bag while quietly halving the nut content. The fruit-and-nut mix shows the same effect from another angle: it costs almost exactly what the nuts-only bag costs per 100 grams ($1.40 vs. $1.41), even though it contains half as many nuts.
What has happened to candy prices since
There is a twist worth knowing about, because it changes how big the chocolate premium probably looks today. The USDA prices in our table date to 2017 and 2018, and candy has not inflated at the same pace as other snacks since then.
In the Bureau of Labor Statistics' consumer price data, the index for candy and chewing gum rose about 58% between its 2017-2018 average and August 2026. Over the same stretch, the index for snacks rose about 25%, and dried and other processed fruit rose about 28%.
If we carry each ingredient forward by its own index, as a rough estimate rather than a shelf price, the chocolate mix's markup over its parts shrinks from about 14% to about 6%. The M&M's, in other words, are no longer the bargain filler they were. The other markups barely move: roughly 16% for nuts and seeds, 27% for fruit and 69% for pretzels. The chocolate bag still costs about twice the can per gram of nut, because that part of the math comes from the recipe, not from inflation.
What the labels on real bags show
All of the math above uses USDA's standard recipes, and it is important to say clearly that no brand's bag is built exactly that way. Real trail mixes vary a lot. The good news is that every package already carries a clue about its nut share, printed right on the back.
Under the federal labeling rule at 21 CFR 101.4, ingredients "shall be listed by common or usual name in descending order of predominance by weight." So the first ingredient on a trail mix label is the heaviest one in the bag. The label will not tell you percentages, but the order tells you what the bag is mostly made of.
To see how real bags line up, we looked at the top 60 trail mix records in USDA's FoodData Central branded foods database, which holds ingredient statements that manufacturers and retailers have filed. A nut or seed came first in 29 of them, and in about 17 of those the lead ingredient was peanuts. Dried fruit came first in 18, a candy or coated piece led in 6, and 7 opened with something else entirely, such as granola, crackers or jerky.
A few examples show the range, by first-listed ingredients only:
Chex Mix trail mix (General Mills): roasted peanuts, then roasted almonds, then candy-coated pieces.
Nice! Magic Mix (Walgreens): peanuts, then raisins, then M&M's.
Schnucks trail mix: raisins, then peanuts, then chocolate gems.
Freshness Guaranteed trail mix (Walmart): a yogurt-flavored coating comes first.
Sunridge Farms Organic Hit the Trail Mix: organic raisins, then organic dry-roasted peanuts.
These records were filed between 2021 and 2023, so a current bag may read differently, and ingredient order alone cannot tell you whether a bag is 30% nut or 60% nut. What it can tell you is which way the scale tips. A bag that opens with raisins or a coating is, by weight, mostly not nuts.
If you are browsing the snack aisle with an eye on what else earns its keep, you might also enjoy our roundup of snacks that tend to fly under the radar.
Price per gram of nut is the headline, but it is not the only way to read the table. Because the same USDA database lists nutrients for each food code, we can also see what a dollar buys in protein and sugar. This is a purely descriptive view of what is in the bag, not a claim about what any snack does for your health.
Per 100 grams, the standard recipes carry the following:
Can of mixed nuts: 605 calories, 19.6 g protein, 7.6 g fiber, 4.5 g sugars, 313 mg sodium.
Nuts and seeds mix: 600 calories, 20.1 g protein, 8.1 g fiber, 4.1 g sugars, 252 mg sodium.
Chocolate mix: 501 calories, 11.7 g protein, 6.0 g fiber, 34.9 g sugars, 146 mg sodium.
Fruit-and-nut mix: 452 calories, 10.9 g protein, 6.5 g fiber, 36.5 g sugars, 134 mg sodium.
Pretzel mix: 473 calories, 13.1 g protein, 6.1 g fiber, 19.3 g sugars, 444 mg sodium.
Dividing by price, a dollar of canned mixed nuts buys about 15.7 grams of protein, and a dollar of the plain nut-and-seed mix buys about 14.3. The chocolate, fruit and pretzel mixes fall to between 7.7 and 9.3 grams. Sugar moves the other way: a dollar of the chocolate or fruit mix carries roughly 26 to 28 grams of sugars, about seven to eight times what a dollar of the can carries.
Two details are easy to miss. First, much of the sugar in the fruit mix comes from the dried fruit itself, and the sweetened cranberries in the standard recipe are the single most sugar-dense ingredient on the list. Second, the pretzel mix has the most sodium of the five, at 444 mg per 100 grams, because hard salted pretzels carry far more salt per gram than the nuts do.
For another look at how the nut aisle prices out on protein, our ranking of nut butters takes the same per-dollar approach.
We want you to be able to trust these numbers, so here is exactly where they come from and where they stop.
Important
The prices in this article are USDA national averages from 2017 and 2018, not today's shelf prices. The ratios between them, which drive every conclusion here, do not depend on inflation because every price comes from the same period. The 2026 figures in the chocolate section are labeled estimates.
Prices. Every bag and ingredient price is a method-1 record from USDA's Purchase to Plate national average prices, meaning it links directly to grocery scanner data rather than being imputed from another food. We left out imputed records, including the generic "Trail mix, not further specified" entry. The USDA's documentation explains that the 2017-2018 prices average two years of grocery data from standard grocery stores, supercenters, convenience stores, drug stores and dollar stores, and that one food's price can blend many brands, private labels, package sizes and flavors. It also says prices for the next survey period are expected no earlier than spring 2027.
Recipes and nutrients. The recipe weights and nutrient values come from USDA's 2017-2018 food and nutrient database, chosen so that the food codes match the price file exactly. These are standard recipes, not any brand's formula, and we never present them as the composition of a specific product.
Inflation. For the rough 2026 estimate, we used the Bureau of Labor Statistics' consumer price indexes for snacks, for dried and other processed fruit, and for candy, comparing each one's 2017-2018 average with its August 2026 reading. That gives factors of about 1.25 for snacks, 1.28 for dried fruit and 1.58 for candy. We assumed the nuts, seeds, pretzels and finished bags track the snacks index.
What this cannot tell you. Your own store may price things very differently. A single-store comparison can even flip the answer: one budget blogger found that at Aldi, a pre-made bag came out cheaper than buying the same ingredients separately, as The Frugal Girl documented in her own receipts. National averages describe the typical shelf, not every shelf. Warehouse clubs are also not listed among the store types in the USDA price data, so bulk pricing is outside what we measured.
The store you shop at can shift nutrition-per-dollar math in a big way, which we explored across major chains in a separate piece.
Trail mix is not a bad buy, and plenty of people happily pay a little extra for a bag that is ready to toss in a backpack or a desk drawer. What the numbers show is simply where that extra goes. In a plain nut-and-seed mix, the premium is modest. In a fruit, chocolate or pretzel mix, you are paying for half as many nuts, and in the pretzel mix, you are paying about 70% more than the ingredients would cost on their own.
If you like having the option, the ingredient list on the back of the bag and a can of mixed nuts on the shelf next to it are all you need to run your own version of this math. Whichever way you go, you will know exactly what the mixing is costing you.
About the Author
Ryan May
Senior Editor
Ryan May is a digital publishing leader with more than 25 years of experience turning complex information into clear, useful editorial work. At Daily Vitality, he focuses on evidence-led reporting about nutrition, fitness, healthy aging, and long-term wellbeing, informed by his own interests in cooking, yoga, cycling, and sustainable healthy habits.
Per 100 grams on the shelf, the two are close, and the chocolate mix is roughly the same price as the can in USDA's national averages. Per gram of nut, though, every trail mix type costs more than the can, from about 12% more for the plain nut-and-seed mix to about 2.7 times as much for the pretzel mix.
Its bag price is the highest of the four styles, while its ingredients are the cheapest to buy separately. Hard salted pretzels cost about $0.64 per 100 grams in USDA's data, roughly half the price of the nuts they replace, so the recipe costs about $1.00 to build but sells for about $1.70.
Yes. USDA's standard mixed nuts are close to half peanuts by weight, and those mixed nuts are what go into its standard trail mix recipes. Peanuts are botanically a legume, and they are the main reason a can of mixed nuts is so inexpensive.
No. They are USDA national averages from 2017 and 2018, the most recent release available. The comparisons between bags hold regardless of inflation because every price comes from the same period, but the dollar amounts are historical.
Not necessarily. The markup pays for convenience, portioning and variety you might not assemble at home. The numbers simply make that premium visible, so you can decide whether it is worth it for your routine.
Federal labeling rules require ingredients to be listed in descending order by weight, so the first ingredient is the heaviest. A label that starts with raisins, cranberries or a coated candy is mostly not nuts, while one that starts with peanuts or almonds leans the other way. The label will not give you exact percentages.
Very little. In the standard recipes seeds make up only 10 to 20 grams of every 100, and they cost slightly less than the mixed nuts. Replacing them with extra mixed nuts moves the built-from-parts cost of the fruit mix by about two cents per 100 grams.
The plain nut-and-seed mix, at about 14.3 grams of protein per dollar in USDA's 2017-2018 prices. That is close to the 15.7 grams per dollar from a can of mixed nuts, and well ahead of the chocolate, fruit and pretzel mixes at 7.7 to 9.3 grams.
It might. Warehouse clubs are not among the store types listed in the USDA price data, so bulk prices were outside this comparison. The same method still works with any store's prices: divide the bag price by its nut share and compare it with the parts.
U.S. Bureau of Labor Statistics. (2026). Consumer Price Index for All Urban Consumers: Snacks, U.S. city average (CUUR0000SEFT03). Retrieved from https://data.bls.gov/timeseries/CUUR0000SEFT03
U.S. Bureau of Labor Statistics. (2026). Consumer Price Index for All Urban Consumers: Candy and chewing gum, U.S. city average (CUUR0000SEFR02). Retrieved from https://data.bls.gov/timeseries/CUUR0000SEFR02