Fact-checked · , including National Library of Medicine, U.S. Department of Agriculture & Office of the Federal Register
Credit: Shutterstock
Key Takeaways
•Measured on one consistent basis, saturated fat across ten popular steak cuts runs from 1.41 g to 3.85 g per 100 grams — a 2.7-fold gap, and not in the order most people expect.
•On some cuts, trimming matters more than the cut itself: eating the separable fat adds roughly 11% to a flank steak and roughly 99% to a ribeye.
•Ground beef is a separate decision entirely, because below about 85% lean the number on the package stops predicting what ends up on the plate.
Stand at a supermarket meat case and the question is simple enough: if I buy beef, how much does the cut actually change what I get? Most people carry an answer around already — a rough ranking absorbed from menus, marketing and habit, in which ribeye is the splurge and sirloin is the sensible one. Very few have ever checked it against a number.
It is a fair question, because beef is not one food. How much saturated fat a cut carries depends on which primal it came from, how much fat is woven through the muscle, how much sits on the outside, and how much of that fat survives to the plate. Those variables move the result far more than the word "beef" on a label suggests.
What follows is a comparison of ten steak cuts you would actually find at a US supermarket counter — skirt, flat iron, strip, tenderloin, T-bone, flank, ribeye, chuck shoulder, top sirloin and eye of round — measured on one declared basis, so the numbers can be read against each other rather than collected from wherever they happened to appear. For each cut: saturated fat, total fat, protein, calories, and a protein-to-fat ratio. Ground beef gets its own section on its own basis, because a lean percentage on a package is a different kind of claim than a named cut, and the two cannot honestly share a table.
This is not a survey of every beef cut, and it is not a verdict on which beef belongs in anyone's cart. Roasts, briskets, short ribs and most of the round primal sit outside the set. The aim is narrower and more useful: to show where familiar cuts actually fall, where the gap between them is real, and where it turns out to be a good deal smaller than reputation implies.
Why I Looked More Closely at Saturated Fat in Beef
I buy beef most weeks, and for years I sorted it the way most people do — ribeye is the indulgence, sirloin is the sensible one, filet is what you order when you want to feel good about spending too much. That sorting felt like knowledge. It was closer to folklore.
What broke it was a small thing. I was comparing two packages at the counter and realized I could not have told you, within a factor of two, how much saturated fat separated them. Not roughly. Not at all. My mental ranking turned out to be inherited rather than checked.
So I checked, and a fair amount of what follows surprised me. None of it is medical guidance, and none of it is a reason to change anything on the strength of a single article. If you are weighing beef against other proteins entirely, the long-term outcome data on meat-eaters, pescatarians and vegetarians is a different and larger question than this one.
How We Ranked These Cuts
Credit: Daily Vitality
Every number in the ranked list below comes from the SR Legacy dataset in USDA's FoodData Central, retrieved on August 27, 2026, and every figure sits on one declared basis: cooked, separable lean only, trimmed to 0 inches of fat, all grades, per 100 grams.
That phrase is doing a lot of work, so it is worth unpacking. "Separable lean only" means a technician physically dissected away every piece of fat that could be separated from the muscle before the sample was analyzed. "Trimmed to 0 inches" means no external fat cap. "All grades" means the record blends Prime, Choice and Select rather than flattering or penalizing any one of them. Hold all three constant and you are comparing muscle to muscle. Change any one of them and the comparison quietly stops being a comparison.
Three limitations belong in the open before you read the table. First, cooking method varies by record — some cuts are broiled, some grilled — because that is how the underlying survey work was done, and no single method exists for all ten. Second, the T-bone is the one place the basis could not be held: the database contains no all-grades record at the 0-inch lean-only baseline, so the Choice record is used and labeled, with the Select value noted alongside. Third, these are sample means. A difference of a tenth of a gram between two cuts is noise, not a finding.
Per 100 grams, rather than per 3-ounce portion, because the federal thresholds for "lean" and "extra lean" are themselves written per 100 grams — the same number does double duty. A 3-ounce cooked portion is 85 grams, so scale any figure below down by about 15% to picture a restaurant serving.
Rank
Cut
Saturated fat (g)
Total fat (g)
Protein (g)
Calories
Protein per gram of fat
1
Inside skirt steak
3.85
10.1
26.7
205
2.6
2
Flat iron (shoulder top blade)
3.77
9.23
28.2
196
3.1
3
Strip steak (top loin, boneless)
3.41
8.41
29.5
202
3.5
4
Tenderloin (filet)
3.30
8.32
30.7
198
3.7
5
T-bone (Choice)
3.27
9.61
26.0
198
2.7
6
Flank steak
3.07
7.40
27.9
186
3.8
7
Ribeye (rib, small end)
2.87
7.53
29.4
193
3.9
8
Chuck shoulder steak (boneless)
2.43
5.82
28.6
175
4.9
9
Top sirloin
2.20
5.79
30.6
183
5.3
10
Eye of round steak
1.41
3.90
29.8
155
7.6
Ranked from most to least saturated fat. Position is a statement about one nutrient on one basis — it is not a ranking of quality, value, or suitability for any particular person.
1. Inside Skirt Steak
The fajita cut tops the table
Skirt steak carries 3.85 g of saturated fat and 10.1 g of total fat per 100 grams — the highest of the ten, and the only one of the ten whose total fat exceeds the federal threshold for a "lean" claim, which requires less than 10 g of fat per 100 grams along with 4.5 g or less of saturated fat.
It misses by a tenth of a gram. That is worth saying plainly rather than dramatizing: skirt steak is not an outlier in nutritional terms, it simply sits at the top of a fairly tight band.
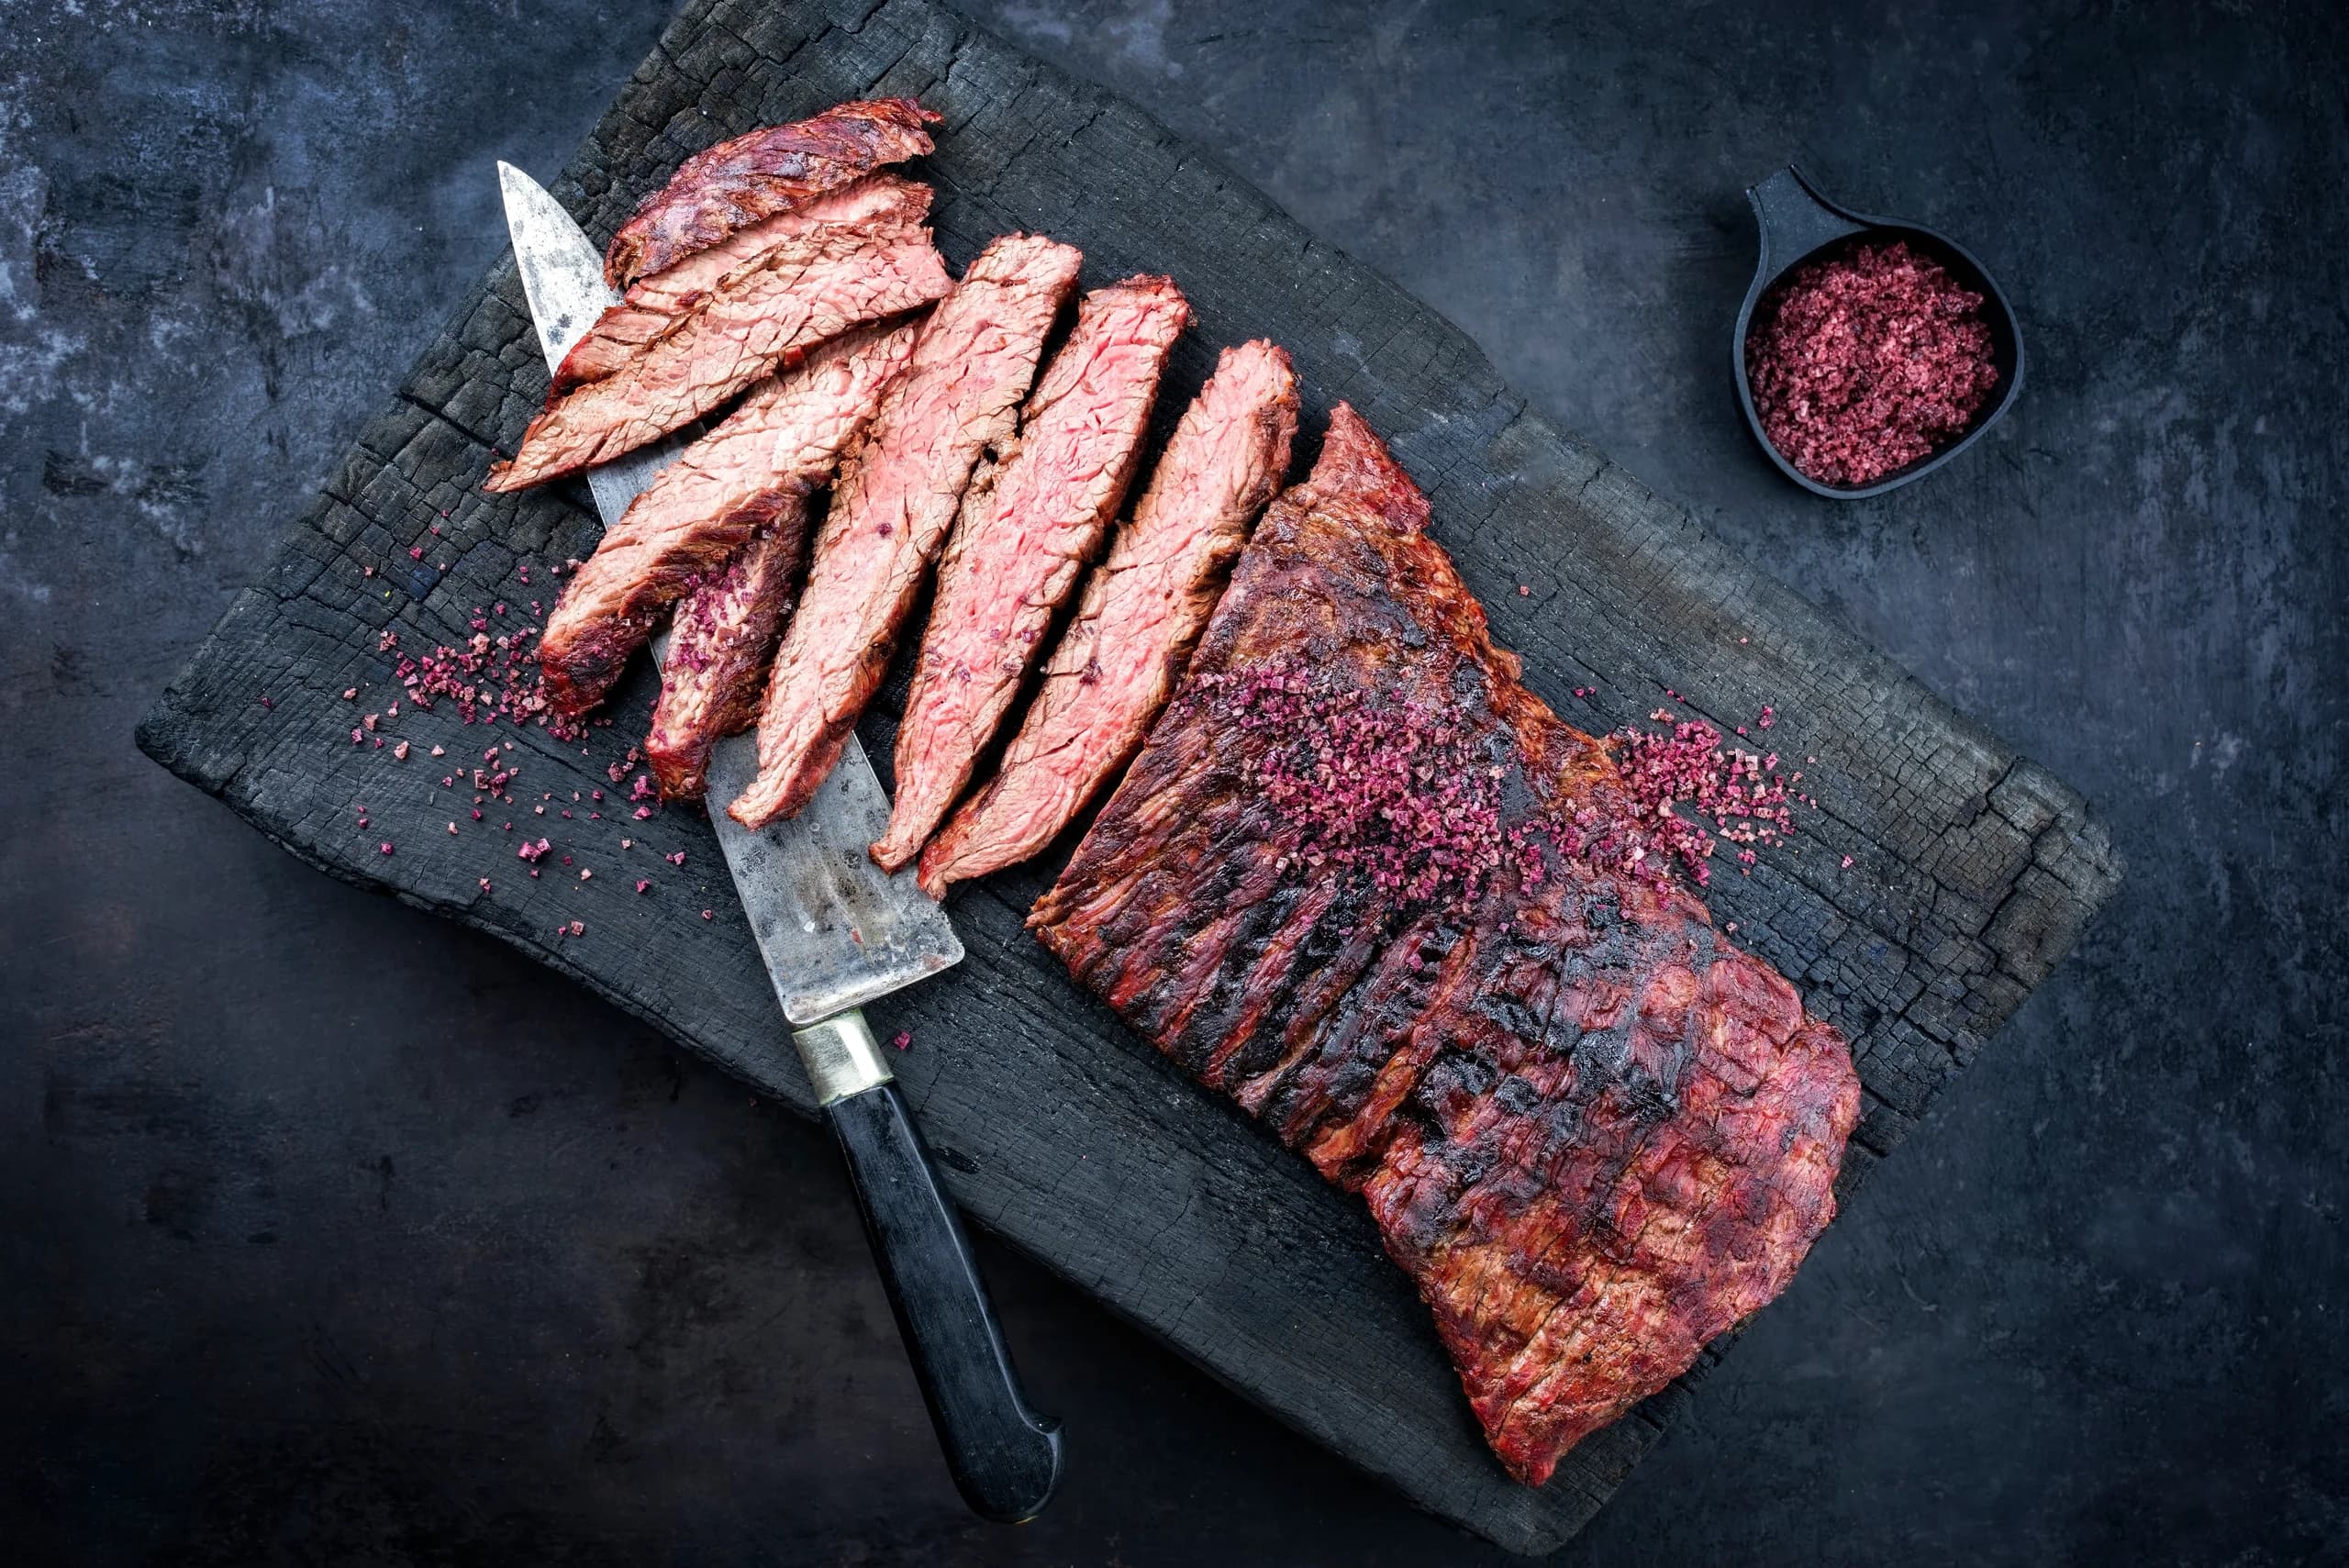
What sets it apart is structure. Skirt comes from the plate, a hard-working muscle with coarse, open grain and fat woven through it rather than layered on the outside. That is precisely why it takes marinade well and cooks fast over high heat, and why it is the default in fajitas and carne asada. The same architecture that makes it flavorful makes it difficult to trim meaningfully — there is not much separable fat to remove, because most of the fat is inside the grain.
Its protein-to-fat ratio of 2.6 is the lowest in the set. At 26.7 g of protein per 100 grams it is not a poor protein source in absolute terms; it just delivers that protein alongside more fat than any other cut here.
2. Flat Iron Steak
A modern cut with a modern problem
Flat iron — sold as shoulder top blade — carries 3.77 g of saturated fat, 9.23 g of total fat and 28.2 g of protein per 100 grams. It lands second, a hair behind skirt.
This one surprises people, because flat iron is a relatively recent invention. It was engineered in the early 2000s by researchers looking for tenderness in the underused chuck primal, and it arrived with a reputation as the smart, economical steak. That reputation is about tenderness and price. It was never about fat.
The cut sits on either side of a thick band of connective tissue in the shoulder, and the marbling around it is generous. What you gain in tenderness relative to the rest of the chuck, you partly pay for in fat.
Trimming helps here, but less than you might hope. Eaten with its separable fat rather than without, the same cut rises to 4.53 g of saturated fat — about a 20% increase. That is a real difference, though a modest one next to what trimming does to a ribeye.
3. Strip Steak
The cut with the most aliases
Strip steak carries 3.41 g of saturated fat, 8.41 g of total fat and 29.5 g of protein per 100 grams — solidly mid-table, with the third-highest protein figure in the set.
The naming is the practical problem. A boneless top loin steak is sold as strip steak, New York strip, Kansas City steak, hotel cut strip steak, ambassador steak and club sirloin steak depending on where you shop, which USDA notes among the reasons it recommends packages carry the primal cut name alongside the product name. Six names, one muscle, one nutritional profile.
Strip comes from the short loin, the same primal that produces the T-bone and the porterhouse. On a T-bone, the strip is the larger of the two muscles flanking the bone; the smaller one is tenderloin. Buy a strip steak and you are buying the majority partner of a T-bone, sold on its own.
That relationship explains its position. Strip and T-bone land within 0.14 g of each other in the table, which is exactly what you would expect from two cuts drawn from the same primal.
4. Tenderloin
The premium cut that isn't the lean one
Tenderloin — filet mignon at a restaurant — carries 3.30 g of saturated fat, 8.32 g of total fat and 30.7 g of protein per 100 grams. It has the most protein of any cut in the set.
It also has more saturated fat than ribeye, chuck shoulder steak, top sirloin and eye of round. This is the first place the data openly contradicts reputation. Tenderloin is the most expensive cut on most counters and it carries an unspoken health halo, and on this measure that halo is not earned.
The value in tenderloin is texture. It comes from the psoas major, a muscle that does almost no work, which is why it is extraordinarily tender and why it has relatively little of the connective tissue that toughens harder-working cuts. Tenderness and leanness are different properties, and they are not correlated in the direction most shoppers assume.
The figure is unusually stable, which raises confidence in it. The 1/8-inch-trim record gives 3.20 g — close enough to the 0-inch figure that trim assumptions barely move the result. Where tenderloin does lead is protein density, which matters if total daily intake is what you are tracking; how that protein is distributed across the day is a separate question with its own evidence base.
5. T-Bone Steak
One steak, two muscles, one caveat
The T-bone carries 3.27 g of saturated fat, 9.61 g of total fat and 26.0 g of protein per 100 grams. This is the one entry in the table that is not on the all-grades basis, because no such record exists at the 0-inch lean-only baseline. The figure shown is Choice; the Select record gives 2.82 g of saturated fat and 7.36 g of total fat.
That gap between grades — 3.27 against 2.82, roughly 16% — is itself informative. It is a reasonable estimate of what the grade shield is worth on this cut, and it is larger than the difference between several adjacent positions in the table.
Structurally the T-bone is two steaks sharing a bone: strip on the larger side, tenderloin on the smaller. Its 26.0 g of protein per 100 grams is the joint lowest in the set, and its protein-to-fat ratio of 2.7 is second lowest. A T-bone delivers less protein per gram of fat than either of its component muscles sold separately, which reflects how the bone-in cut is portioned and analyzed.
Its larger sibling, the porterhouse, is cut further back where the tenderloin section is thicker. Eaten with its fat, porterhouse reaches 7.27 g of saturated fat per 100 grams — the highest figure encountered anywhere in this research.
6. Flank Steak
Credit: Shutterstock
Consistent, and unusually indifferent to trimming
Flank steak carries 3.07 g of saturated fat, 7.40 g of total fat and 27.9 g of protein per 100 grams. Mid-table on saturated fat, and at 186 calories per 100 grams among the lighter cuts in the set.
Its most useful property does not show up in the ranking at all. Flank is the cut least affected by whether you trim it: eaten with its separable fat, it rises only to 3.40 g of saturated fat, an increase of about 11%. Every other cut examined moved further, several of them far further.
The reason is anatomical. Flank is a flat sheet of abdominal muscle with long, parallel fibers and very little internal marbling or external fat cap. There is simply not much fat available to leave on. What you see in the case is close to what you eat.
That consistency is worth something practical. A flank steak's nutritional profile is largely independent of how carefully it is trimmed, or how disciplined anyone is at the table — which is not true of the cuts above it. It is worth resisting the pull to call this the best choice, though. Flank is chewy, needs slicing against the grain, and is unforgiving past medium.
7. Ribeye
The reputation belongs to the cap, not the steak
Here is the result that reframes the whole table. Ribeye carries 2.87 g of saturated fat, 7.53 g of total fat and 29.4 g of protein per 100 grams — seventh of ten, below tenderloin, strip, T-bone and flank. On a separable-lean-only basis, the lean muscle of a ribeye is not high in saturated fat.
Two things make that finding true rather than merely surprising, and both need stating.
The first is that a ribeye is not one tissue. Its outer cap, the spinalis dorsi, carries 5.57 g of saturated fat and 15.7 g of total fat per 100 grams. The central eye — sold on its own as ribeye filet — carries 3.20 g and 9.20 g. Same steak, roughly 1.7 times the saturated fat in the cap, and the cap is the part most people consider the best bite. Within-cut variation here rivals the variation across the entire ten-cut table.
The second is trimming, and this is where ribeye separates itself decisively. Eaten with its separable fat, ribeye goes from 2.87 g to 5.72 g of saturated fat per 100 grams — it roughly doubles. No other cut examined comes close to that swing.
So both statements are true at once. A carefully trimmed ribeye, eaten lean, is a mid-table cut. A ribeye eaten as ribeye usually is — cap included, fat left on — is near the top of the range. The cut is not the variable that matters most here. The eating is.
8. Chuck Shoulder Steak
The cheapest cut in the leanest third
Boneless chuck shoulder steak carries 2.43 g of saturated fat, 5.82 g of total fat and 28.6 g of protein per 100 grams, at 175 calories. It ranks third-leanest of the ten, ahead of tenderloin, strip steak, T-bone, flank, skirt and flat iron.
It is also, in most US supermarkets, among the cheapest steak cuts on the shelf. The correlation between price and saturated fat across this table is weak at best, and at the ends of the range it inverts outright: the two leanest steak cuts here are also two of the three least expensive.
Chuck is a working primal — shoulder muscle, more connective tissue, generally suited to moist heat like braising. But this particular record is for a grilled steak, so the figure applies to the cut prepared as a steak, not as a pot roast. Cooked hot and fast and sliced thin, it behaves reasonably well.
The trade-off is real and worth naming: it is less tender than anything above it in the table, and it rewards marinating and careful slicing in a way that a strip steak does not. If value per gram of protein is the lens you are applying, chuck shoulder belongs in the same conversation as the foods that deliver the most protein per dollar.
9. Top Sirloin
The conventional answer holds up
Top sirloin carries 2.20 g of saturated fat, 5.79 g of total fat and 30.6 g of protein per 100 grams — second-leanest in the set, with the second-highest protein figure and a protein-to-fat ratio of 5.3.
This is the one piece of received wisdom the data supports without qualification. Sirloin genuinely is the leaner middle option, it genuinely does carry more protein per gram of fat than the premium cuts, and it is widely available at a moderate price.
The caveat is trimming, and it is larger than flank's. Eaten with its separable fat, top sirloin rises from 2.20 g to 3.75 g of saturated fat — about a 70% increase, which would move it from ninth position to fourth. Sirloin is lean when it is trimmed and merely average when it is not.
10. Eye of Round Steak
The only extra-lean cut in the set
Eye of round carries 1.41 g of saturated fat, 3.90 g of total fat, 29.8 g of protein and 78 mg of cholesterol per 100 grams. It is the leanest of the ten by a wide margin — 63% less saturated fat than skirt steak — and the only cut in the set that clears all three federal thresholds for an "extra lean" claim: under 5 g of total fat, under 2 g of saturated fat, and under 95 mg of cholesterol per 100 grams.
Its protein-to-fat ratio of 7.6 is not close to anything else here. The next best, top sirloin, sits at 5.3. Eye of round delivers roughly three times as much protein per gram of fat as skirt steak.
It is also nearly indifferent to trimming, rising only to 1.67 g with its separable fat left on — about 18%, and from such a low base that the absolute change is a quarter of a gram.
The honest counterweight is texture. Eye of round comes from the rear leg, it is very lean by construction, and lean means less forgiving: overcook it and it turns dry and tight. It is at its best sliced thin for sandwiches, cooked to a lower final temperature, or braised. Cuts like this tend to earn their place through the wider eating pattern rather than any single meal, much as specific vegetables do in cardiovascular research.
Ground Beef Is a Separate Grocery-Store Decision
Credit: KK Stock / Shutterstock
Ground beef cannot be dropped into the table above, and the reason is not fussiness. A lean percentage is a ratio of raw weight, not a cut specification. There is no separable fat in a grind — the fat is already distributed through it — so "separable lean only" is meaningless here. Ground beef needs its own basis, and the one used below is patty, cooked, pan-broiled, per 100 grams, because that preparation exists for every lean percentage in the database.
Label
Saturated fat (g)
Total fat (g)
Protein (g)
Calories
70% lean / 30% fat
6.08
15.5
22.9
238
75% lean / 25% fat
6.28
16.4
23.4
248
80% lean / 20% fat
6.03
15.9
24.0
246
85% lean / 15% fat
5.33
14.0
24.6
232
90% lean / 10% fat
4.19
10.7
25.2
204
93% lean / 7% fat
3.29
8.01
25.6
182
95% lean / 5% fat
2.59
5.94
25.8
164
97% lean / 3% fat
1.80
3.65
26.0
144
Read the top three rows again. They do not descend. Cooked 80/20 lands at 6.03 g, 70/30 at 6.08 g, and 75/25 at 6.28 g — three products spanning a ten-point difference in labeled lean percentage, arriving within a quarter of a gram of each other.
That is not a data error. It is rendering. A fattier raw patty loses proportionally more of its fat to the pan, so the differences compress dramatically during cooking. Below roughly 85% lean, the number on the package largely stops predicting what reaches the plate.
Above that threshold, the label starts working hard. The step from 85/15 to 90/10 removes 1.14 g of saturated fat per 100 grams; the step from 90/10 to 93/7 removes another 0.90 g. The money spent moving from 70/30 to 80/20 buys almost nothing on this measure. The money spent moving from 85/15 to 93/7 buys a great deal.
Why the label describes the package, not the plate
Raw 80/20 ground beef contains 20.0 g of total fat, 7.58 g of saturated fat and 17.2 g of protein per 100 grams. The same beef, cooked as a pan-broiled patty, contains 15.9 g of fat, 6.03 g of saturated fat and 24.0 g of protein. Fat and water both leave during cooking; protein does not, so it concentrates.
Preparation shifts things further. The same 80/20 beef gives 6.03 g of saturated fat as a pan-broiled patty, 6.16 g as a baked loaf, 6.55 g as pan-browned crumbles and 6.76 g as a broiled patty — a spread of about 12% from cooking method alone. Meat that sits in its own rendered fat keeps more of it.
One useful thing about the ground beef aisle is that the number you need is legally required to be right there on the front. Federal rules state that when a label carries a lean percentage, a statement of the fat percentage must appear contiguous to it in lettering of the same color, size and type, on the same color background. That is why packages read "80% lean / 20% fat" rather than simply "80% lean."
Important
Comparing the two tables directly is a cross-basis comparison, not a like-for-like one. The steak figures exclude separable fat; the ground beef figures include all the fat in the grind. With that caveat stated: cooked 90/10 ground beef, at 4.19 g of saturated fat per 100 grams, carries more than any of the ten steak cuts on their lean-only basis, where the highest is skirt steak at 3.85 g. Ground beef labeled 93/7 is the first tier that falls inside the steak range.
What Can Change the Numbers
Four variables move these figures, and they do not move them equally.
Trimming is the largest and least evenly distributed. Across the cuts examined, leaving the separable fat on raised saturated fat by about 11% on flank, 18% on eye of round, 20% on flat iron, 70% on top sirloin and 99% on ribeye. The lean-only ranking measures the meat. The trimming decision measures what actually gets eaten, and on a ribeye that decision is worth roughly nine times what it is worth on a flank steak. Measured as beef is more commonly eaten — lean and fat together — the range across the primals widens from 2.7-fold to something closer to 4.4-fold, from eye of round at 1.67 g to porterhouse at 7.27 g.
Grade moves fat but not much else. USDA quality grades track marbling, which is intramuscular fat. Prime accounts for about 2% of graded beef and carries the most marbling; most supermarket beef is Choice or Select, and Select is normally leaner than the higher grades. The asymmetry is the useful part: grade shifts fat meaningfully while protein, vitamin and mineral content stay similar across grades. On the two cuts where both records exist, moving from Choice to Select cut saturated fat by roughly 16% on a T-bone and 17% on a ribeye cap.
Preparation matters more for ground beef than for steak. The 12% spread across cooking methods for 80/20 is real but modest, and it comes mostly from whether rendered fat drains away or gets reabsorbed. For whole-muscle cuts the effect is smaller still.
Portion size is the variable people misjudge most. Every figure here is per 100 grams. A 3-ounce cooked portion is 85 grams; a restaurant ribeye can run 300 grams or more before anyone considers it large. Tripling the portion triples the saturated fat, which will move the total far more than choosing a different cut ever does.
Note
These values are sample means drawn from survey work, not measurements of the specific steak in your cart. Individual animals, feed, aging and butchery all introduce variation. Differences of a few tenths of a gram between adjacent cuts should be read as equivalent rather than meaningfully different.
A stricter benchmark also exists, and readers encounter both. The American Heart Association recommends a dietary pattern achieving less than 6% of total calories from saturated fat, or about 13 g per day at 2,000 calories, framing it as a property of the overall pattern rather than of any single food. Against a 22 g ceiling, a 3-ounce trimmed portion of eye of round contributes about 1.2 g and the same portion of skirt steak about 3.3 g. Against a 13 g target, those same portions represent roughly 9% and 25% of a day.
Four things on the package carry most of the signal:
The primal name. Loin, rib, round and chuck predict more than the marketing name does — round runs leanest, rib and loin run higher, and chuck varies by cut.
The lean percentage and its paired fat percentage, on ground beef only, remembering that both describe the raw weight.
The grade shield, where one is present, which signals marbling rather than nutrition generally.
The visible fat, which is the variable you retain control over after purchase and, on the fattier cuts, the one that moves the result most.
None of this settles what belongs in any particular cart. Saturated fat is one input among several, alongside price, protein, how a cut fits the meal, and what else the week contains — and a beef comparison sits inside a broader set of trade-offs about where nutrition per dollar actually comes from.
The Bottom Line
The gap between popular beef cuts is real. On a like-for-like basis it is 2.7-fold from eye of round to skirt steak, and as beef is more often eaten it widens toward four-fold. Beef is not nutritionally interchangeable, and the assumption that it is turns out to be the expensive one.
But the ranking is not where the leverage sits. Two of the three leanest cuts in this table are among the cheapest on the counter, the most expensive cut is mid-table, and the cut with the worst reputation lands seventh. Reputation, price and saturated fat are three separate axes that happen to have been collapsed into one in most people's heads.
For context on how much room the ceiling leaves: analysis of national survey data found that about one-third of US adults met the recommendation to keep saturated fat below 10% of daily calories, with those who met it averaging 7.4% of daily calories against 13.9% for those who did not. Which is to say the margin is narrower than most people assume, and single-meal choices matter mostly through their accumulation.
No cut in this comparison is the right answer for everyone, and none is disqualified. What the data supports is more modest and more useful: knowing roughly where a cut sits, knowing that trimming moves some cuts far more than others, and knowing that ground beef is a different decision from steak. Beef is one part of a pattern, and what surrounds it on the plate carries its own weight.
About the Author
Ryan May
Senior Editor
Ryan May is a digital publishing leader with more than 25 years of experience turning complex information into clear, useful editorial work. At Daily Vitality, he focuses on evidence-led reporting about nutrition, fitness, healthy aging, and long-term wellbeing, informed by his own interests in cooking, yoga, cycling, and sustainable healthy habits.
Of the ten popular cuts compared here, eye of round steak is lowest at 1.41 g of saturated fat per 100 grams cooked, trimmed and lean only. It is also the only cut in the set that meets all three federal thresholds for an "extra lean" claim. Top sirloin is next at 2.20 g, followed by boneless chuck shoulder steak at 2.43 g.
It depends entirely on how it is eaten. On a strictly lean-only basis the ribeye's muscle carries 2.87 g per 100 grams, which places it seventh of ten — leaner than tenderloin, strip and flank. Eaten with its separable fat left on, the same cut roughly doubles to 5.72 g, which moves it to the top of the range. Ribeye is the cut where the trimming decision matters most.
Tenderness and leanness are different properties. Tenderloin comes from a muscle that does almost no work, which makes it exceptionally tender, but at 3.30 g of saturated fat per 100 grams it carries more than ribeye, top sirloin, chuck shoulder and eye of round. It does lead the set on protein, at 30.7 g per 100 grams.
It means every piece of fat that could be physically separated from the muscle was removed before the sample was analyzed. It is the basis that makes cuts comparable to each other, but it describes a more thoroughly trimmed portion than most people actually eat — which is why the trimming comparisons in this article matter.
The Dietary Guidelines for Americans, 2025–2030 state that saturated fat consumption should not generally exceed 10% of total daily calories, which works out to roughly 22 g on a 2,000-calorie day. The American Heart Association recommends a stricter dietary pattern of less than 6% of calories, about 13 g per day at the same calorie level.
Not on these records. Cooked 90/10 ground beef carries 4.19 g of saturated fat per 100 grams, which is higher than any of the ten steak cuts on their lean-only basis. Ground beef at 93/7 is the first tier that falls inside the steak range. The comparison crosses two different measurement bases, though, so it should be read as directional rather than exact.
Because fat renders out during cooking, and a fattier raw patty loses proportionally more of it. Cooked pan-broiled patties give 6.03 g for 80/20, 6.08 g for 70/30 and 6.28 g for 75/25 — effectively indistinguishable. Below roughly 85% lean, the label largely stops predicting the cooked result.
Yes, because grade tracks marbling, which is intramuscular fat. Prime carries the most and accounts for about 2% of graded beef; Select is normally the leanest of the retail grades. On the cuts where both records exist, moving from Choice to Select reduced saturated fat by roughly 16% to 17%. Protein, vitamin and mineral content stay broadly similar across grades.
Federal regulation defines "lean" as less than 10 g of total fat, 4.5 g or less of saturated fat, and less than 95 mg of cholesterol per 100 g of product. "Extra lean" requires less than 5 g of total fat, less than 2 g of saturated fat, and the same cholesterol limit. Both thresholds are written per 100 grams, which is about a 3.5-ounce portion.
For ground beef, modestly — the same 80/20 beef ranges from 6.03 g as a pan-broiled patty to 6.76 g as a broiled patty, a spread of about 12%, driven mainly by whether rendered fat drains away. For whole-muscle steaks the effect is smaller, and portion size and trimming both move the result considerably more than method does.
Every figure is per 100 grams of cooked meat. A 3-ounce cooked portion is 85 grams, so scale down by about 15%. Restaurant steaks frequently run 250 to 350 grams, at which point portion size affects the total far more than the choice of cut does.
Sources
U.S. Department of Agriculture, Agricultural Research Service. FoodData Central, SR Legacy dataset (beef records, retrieved August 27, 2026). Retrieved from https://fdc.nal.usda.gov/
U.S. Department of Agriculture & U.S. Department of Health and Human Services. (2025). Dietary Guidelines for Americans, 2025–2030. Retrieved from https://cdn.realfood.gov/
U.S. Department of Agriculture & U.S. Department of Health and Human Services. Dietary Guidelines for Americans (program home page). Retrieved from https://www.dietaryguidelines.gov/
Show 5 more sourcesHide additional sources
Office of the Federal Register. 9 CFR 317.362 — Nutrient content claims for fat, fatty acids, and cholesterol content. Retrieved from https://www.ecfr.gov/
U.S. Department of Agriculture, Food Safety and Inspection Service. (2024). Beef From Farm to Table. Retrieved from https://www.fsis.usda.gov/
American Heart Association. (2024). Saturated Fats. Retrieved from https://www.heart.org/
Bowman, S. A., & Clemens, J. C. (2022). Saturated Fat and Food Intakes of Adults: What We Eat in America, NHANES 2017–2018 (Dietary Data Brief No. 43). U.S. Department of Agriculture, Food Surveys Research Group. Retrieved from https://www.ncbi.nlm.nih.gov/
Meadows, L. (2013). What's Your Beef – Prime, Choice or Select? U.S. Department of Agriculture, Agricultural Marketing Service. Retrieved from https://www.usda.gov/